This page provides the results of gamma counting with the PGT HPGe detector at SNOLAB for the sample of interest. Collected spectra are analyzed with a custom C++-based set of scripts. It is a root-based implementation. Peak detection efficiencies are estimated from analyzing the Geant4 MC simulations of the sample. Radioactive contamination levels of the sample from U/Th/K/Co/Cs isotopes are listed per line and per decay chain below.
Sample description:
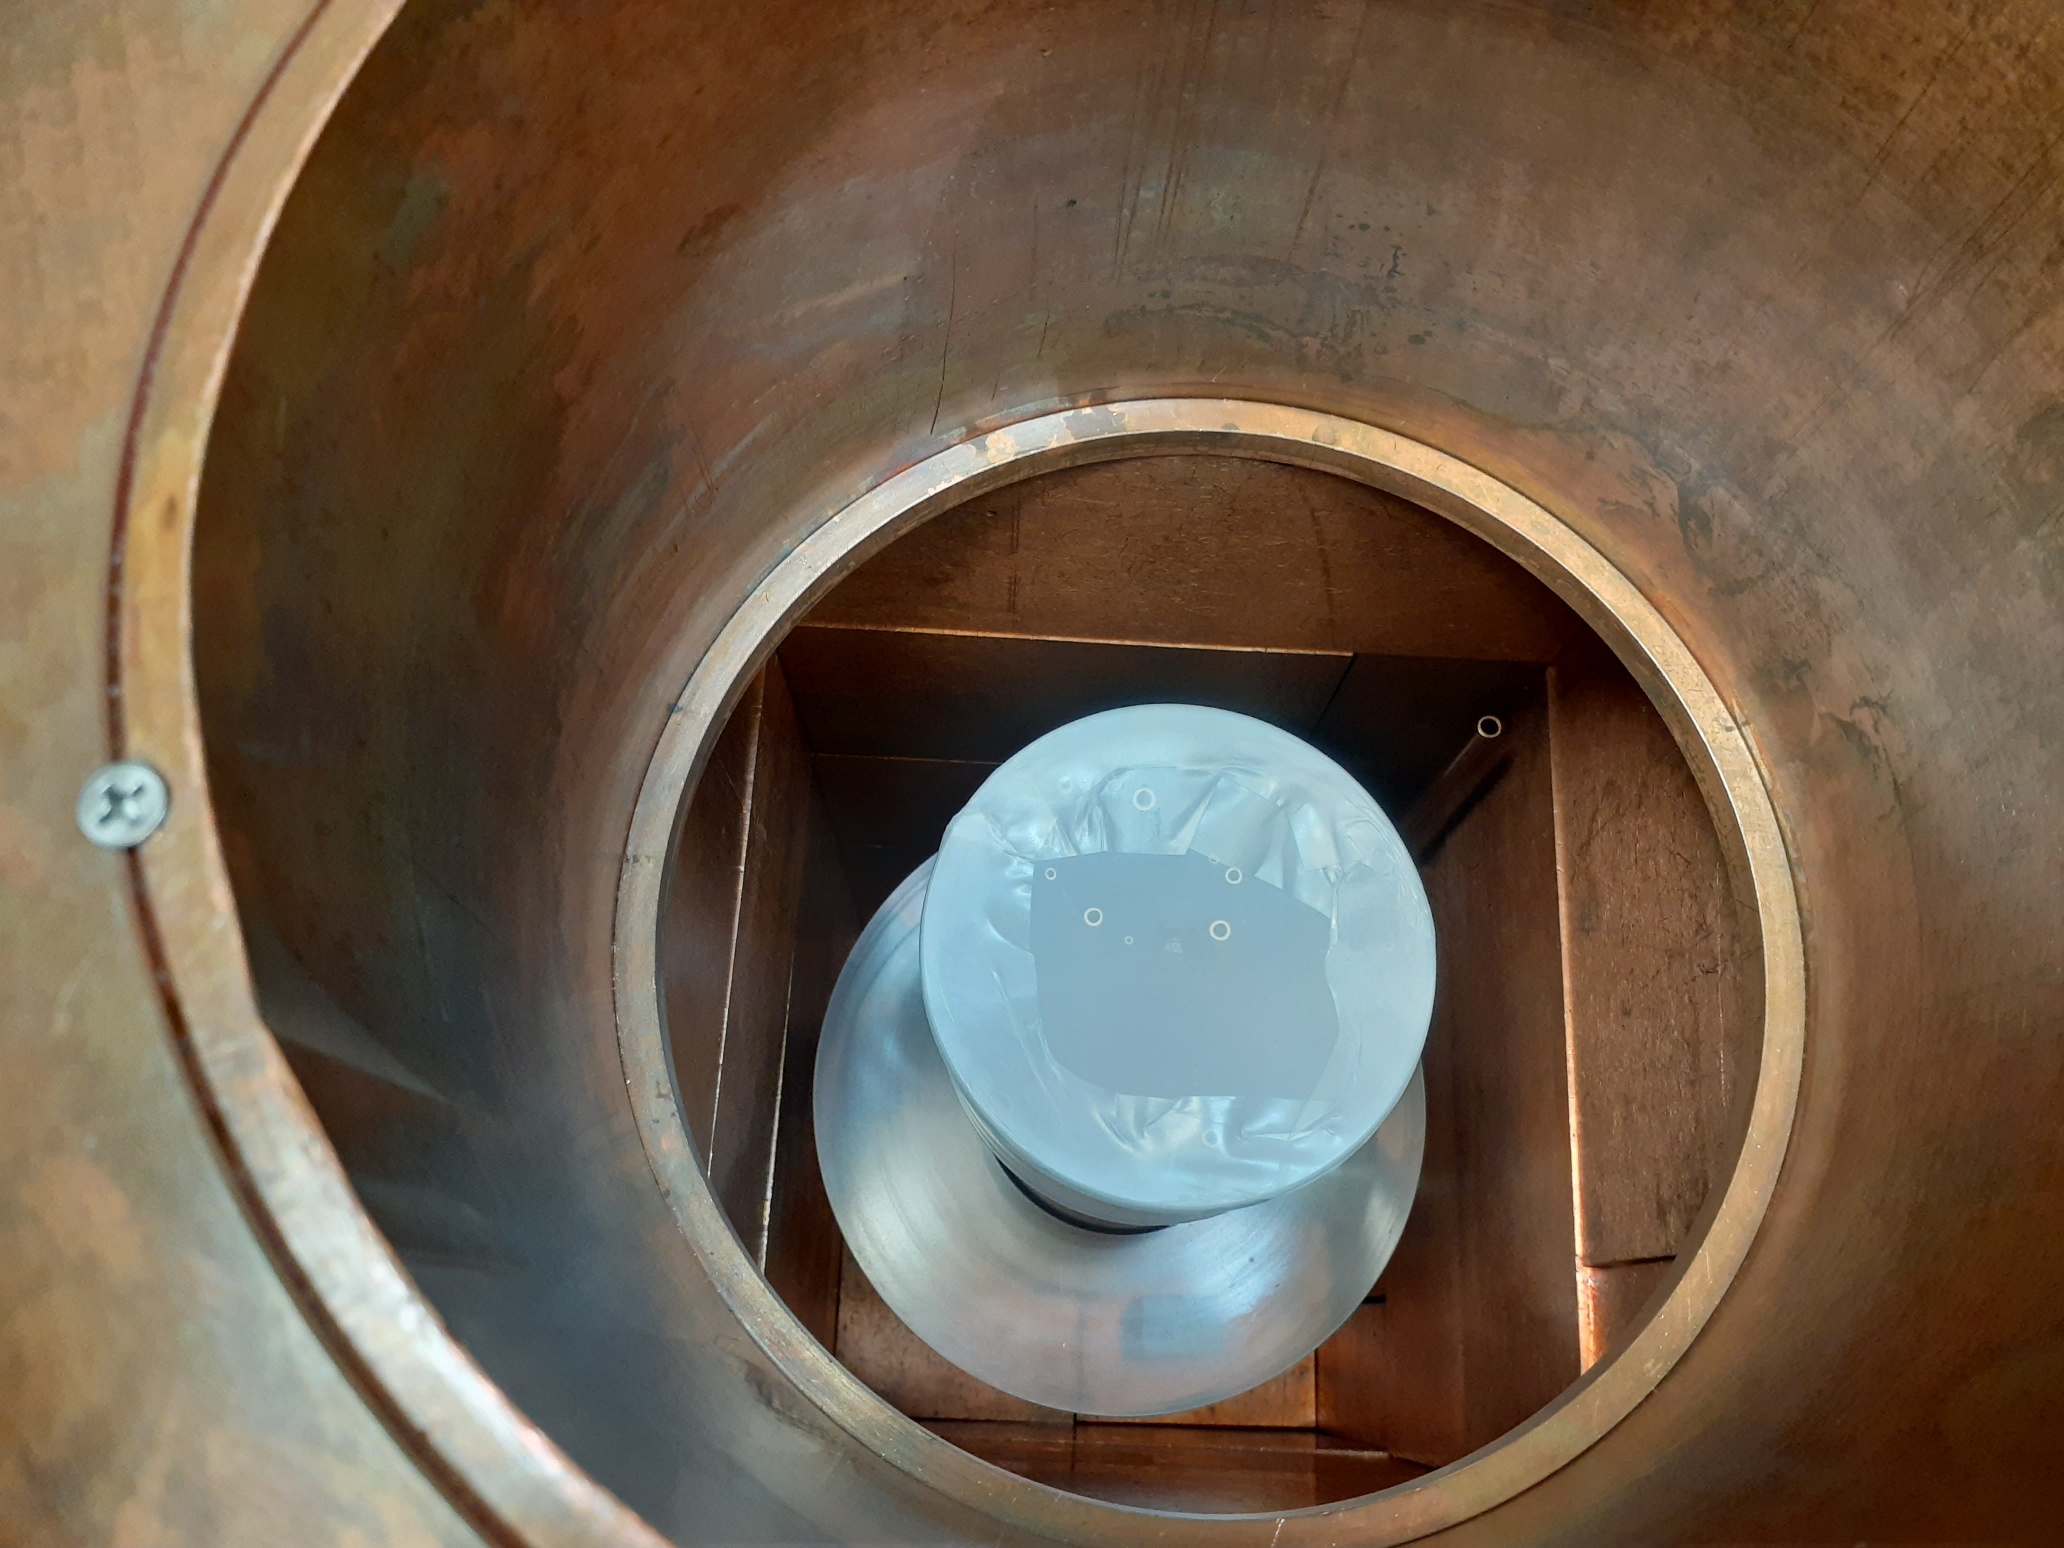
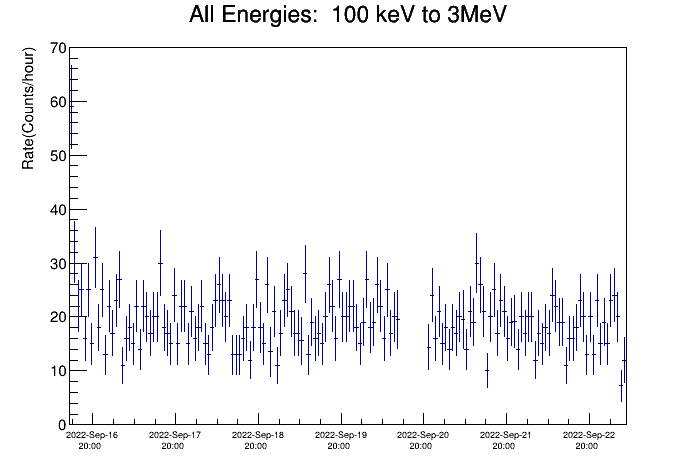
Sample of 133Ba SRS-22-001-A Rinse SolutionAn automatic cut removes runs which show an excess in the event rate in the overall energy region 100keV-3MeV w.r.t. the run average rate. Fig 1.1 shows the event rate.
| Fig. 1.1: Trending plot of the overall energy region. |
 |
| Plot range (keV): | 0 - 200 | 200-1000 | 1000-2000 | 2000-3000 |
| Fig.
2: Energy Spectrum for different ROI |
 |
"Standard" gamma-lines of interest include lines from isotopes in the 238U, 235U, 232Th, 40K, 60Co, and 137Cs.
For each line of interest, we set a window in energy whose lower and upper limits are given by the integer channels nearest to C(E- fW(E)) and C(E+ fW(E)). This window is highlighted in yellow on the plots. The number of counts N(E) in this window is determined by counting.
Per line, we consider two background contributions:
| Line of interest (keV): | 295 | 351 | 609 | 1120 | 1764 | 143 | 163 | 185 | 205 | 911 | 969 | 238 | 727 | 583 | 860 | 2614 | 1461 | 1173 | 1332 | 661 | 356 | |||
| Isotope: | Pb-214 | Bi-214 | U-235 | Ac-228 | Pb-212 | Bi-212 | Tl-208 | K-40 | Co-60 | Cs-137 | Ba-133 | |||||||||||||
| Chain: | U-238 chain | U-235 chain | Th-232 chain | Individual Isotopes | ||||||||||||||||||||
| Fig.
3: Energy spectra per line. Yellow region highlights the counting region for N(E). The green side-bands represent the windows in which the energies are above and below the signal region. |
 |