This page provides the results of gamma counting with the Lively HPGe detector at SNOLAB for the sample of interest. Collected spectra are analyzed with a custom C++-based set of scripts. It is a root-based implementation. Peak detection efficiencies are estimated from analyzing the Geant4 MC simulations of the sample. Radioactive contamination levels of the sample from U/Th/K/Co/Cs isotopes are listed per line and per decay chain below.
Sample description:
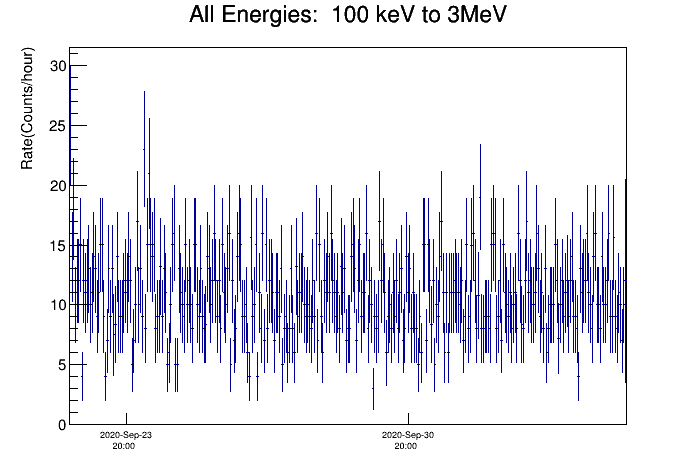
SBC, Silver Plated Copper Coaxial Cable. Cable is Kapton Insulated, 32 AWB, 50 Ohm Coaxial cable.An automatic cut removes runs which show an excess in the event rate in the overall energy region 100keV-3MeV w.r.t. the run average rate. Fig 1.1 shows the event rate.
| Fig. 1.1: Trending plot of the overall energy region. |
|
| Plot range (keV): | 0 - 200 | 200-1000 | 1000-2000 | 2000-3000 |
| Fig.
2: Energy Spectrum for different ROI |
 |
"Standard" gamma-lines of interest include lines from isotopes in the 238U, 235U, 232Th, 40K, 60Co, and 137Cs.
For each line of interest, we set a window in energy whose lower and upper limits are given by the integer channels nearest to C(E- fW(E)) and C(E+ fW(E)). This window is highlighted in yellow on the plots. The number of counts N(E) in this window is determined by counting.
Per line, we consider two background contributions:
| Line of interest (keV): | 295 | 351 | 609 | 1120 | 1764 | 143 | 163 | 185 | 205 | 911 | 969 | 238 | 727 | 583 | 860 | 2614 | 1461 | 1173 | 1332 | 661 | |||
| Isotope: | Pb-214 | Bi-214 | U-235 | Ac-228 | Pb-212 | Bi-212 | Tl-208 | K-40 | Co-60 | Cs-137 | |||||||||||||
| Chain: | U-238 chain | U-235 chain | Th-232 chain | Individual Isotopes | |||||||||||||||||||
| Fig.
3: Energy spectra per line. Yellow region highlights the counting region for N(E). The green side-bands represent the windows in which the energies are above and below the signal region. |
 |